

6 júlí 2026Increase in traffic volume reported in June
Following three months of sustained reduction, total traffic volume was reported to increase on the country’s highways this past June. An increase of 3.6% was reported compared to June of last year, attributed in large part to the considerably high number of vehicles travelling along the Úlfarsfell key counter, affecting country-wide statistics greatly. Since the new year, a 1.0% traffic increase is reported compared to same time last year.
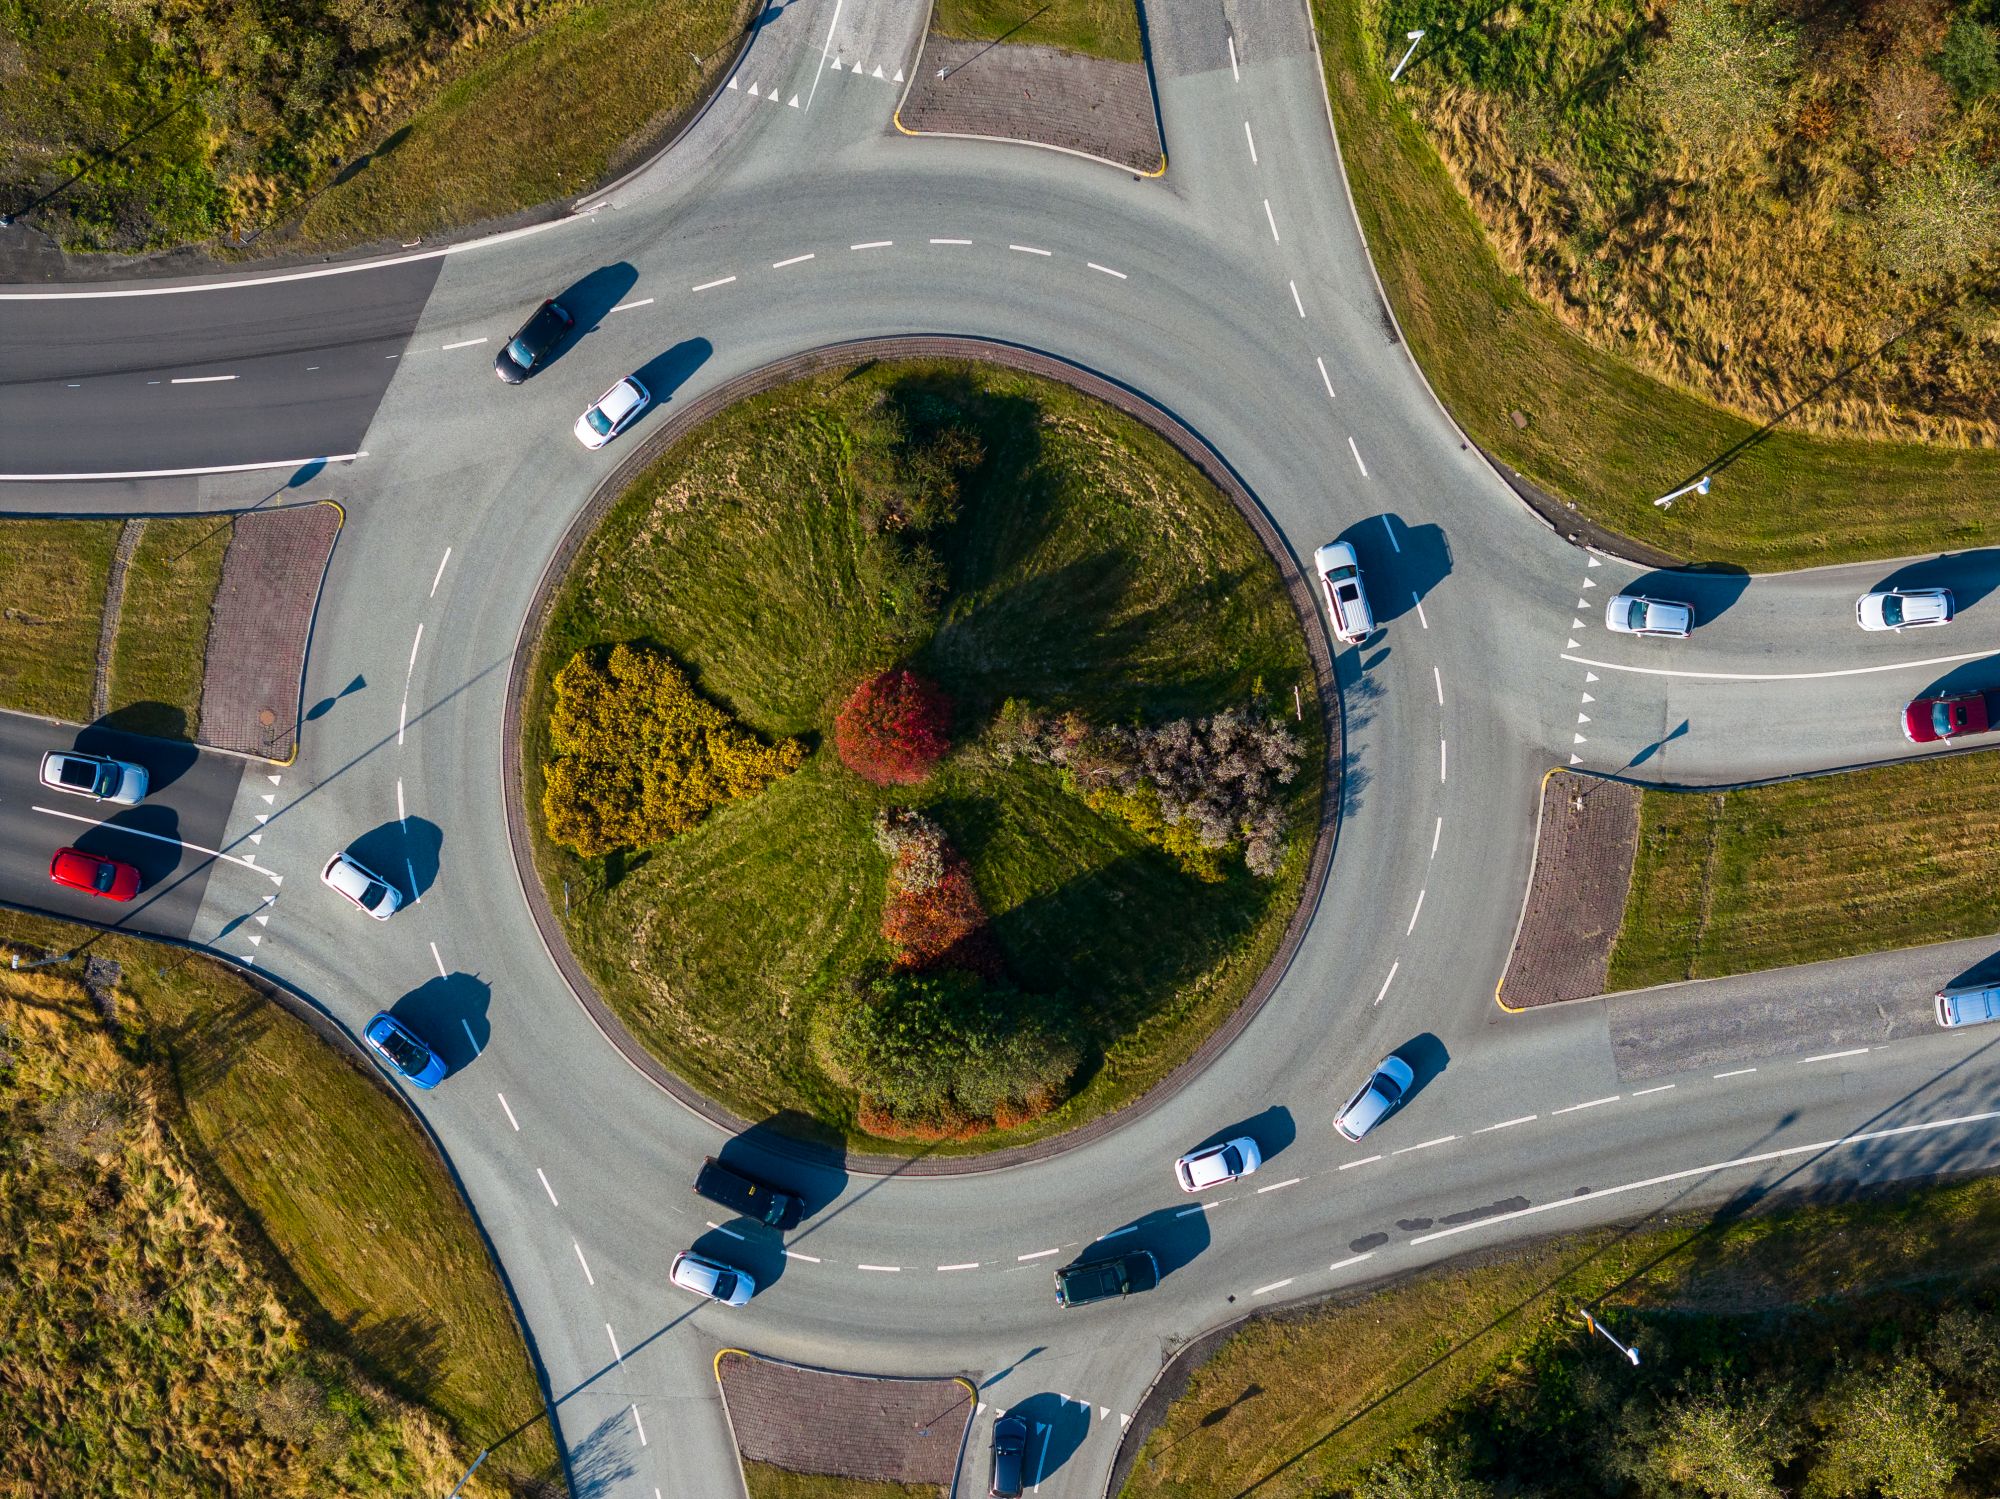
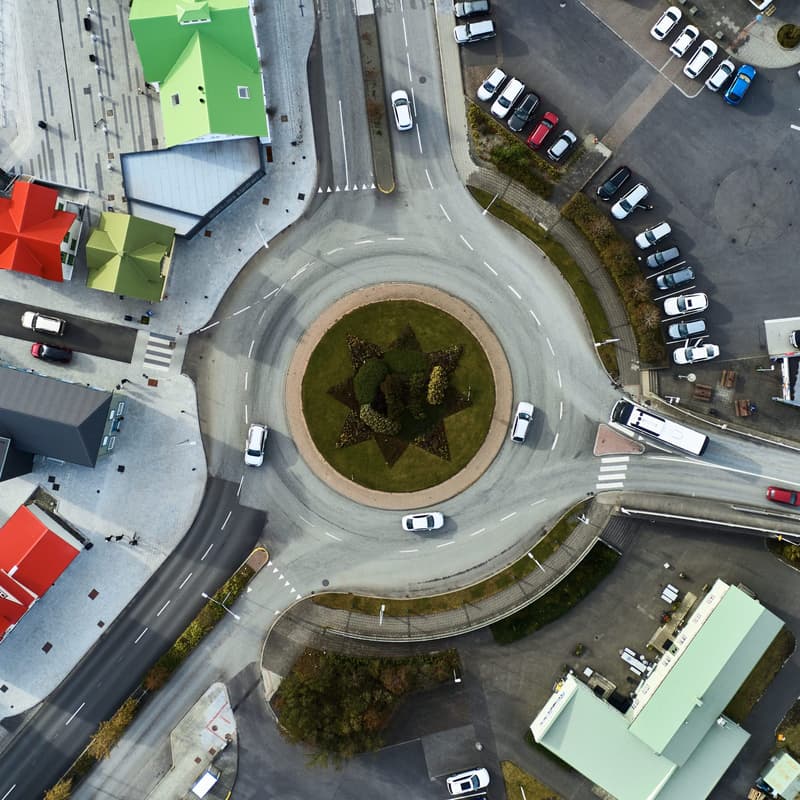
A roundabout on Vesturlandsvegur.
Total traffic volume in South Iceland (-0.6%) and West Iceland (-1.8%) saw minor reductions, but increases were measured elsewhere. The greatest increase in volume was reported along Úlfarsfell (9.5%), whilst the greatest reduction was measured along counters in Mývatnsöræfi (-4.2).
Traffic since the new year.
Total traffic volume has now seen a 1.0% increase since the new year, compared to last year’s numbers. This increase can be considered minimal in comparison with the average increase between 2022-2025 (4.8%).
Traffic by day of week.
Since the new year, total traffic volume has seen increases on Tuesdays (3.0%), Wednesdays (3.2%), Saturdays (0.1%) and Sundays (3.6%), but seen reductions on Mondays (-2.1%), Thursdays (-0.1%) and Fridays (-1.0%). Furthermore, The greatest number of car journeys are undertaken on Fridays, with the fewest journeys being made on Saturdays.
Traffic for the rest of 2026
The IRCA traffic department’s prediction model estimates that total traffic volume will see a 3.5% increase throughout the rest of the year. Should this estimate prove accurate, the country’s highways would see a total traffic volume increase of 2.5% throughout the year.
One should bear in mind that the prediction model does not factor in economic developments, but given the connection between increased traffic and economic growth, total traffic volume will likely increase in accordance with the growth that banks and economic institutions have predicted for the year 2026 — or between 1.5-2.5%.
Disclaimer: All traffic data are subject to revision following detailed review.
2026/2025 | 2025/2024 | |||
Region | Year-by-year June variation | Total from the beginning of the year | Year-by-year June variation | Total from the beginning of the year |
South Iceland | -0,6% | -1,0% | 0,4% | 0,1% |
Capital Region | 7,7% | 2,1% | -2,4% | 0,1% |
West Iceland | -1,8% | -0,6% | 5,3% | 4,7% |
North Iceland | 2,3% | 1,6% | 11,4% | 8,1% |
East Iceland | 1,4% | -0,9% | 12,2% | 6,2% |
Total (weighted) | 3,6% | 1,0% | 1,3% | 1,7% |